




Asylum Grants for Nepalis in U.S. Immigration Courts Fall to Lowest Level Since 2003 as Court Backlog Shrinks

Asylum grants to Nepali applicants in U.S. immigration courts fell to their lowest level since 2003 in fiscal year 2026, even as immigration courts nationwide completed more cases and reduced their overall backlog for a second consecutive year.
Figures from the Transactional Records Access Clearinghouse (TRAC) show that U.S. immigration judges granted asylum to 58 Nepali applicants in fiscal 2026, down from 304 the previous year, a decline of about 81 percent. The annual total was just one higher than the 57 grants recorded in fiscal 2003.
Looking for job?
Click hereThe figures cover asylum decisions made by immigration judges in the federal immigration court system. They do not include asylum grants issued by U.S. Citizenship and Immigration Services (USCIS), which separately adjudicates affirmative asylum applications.
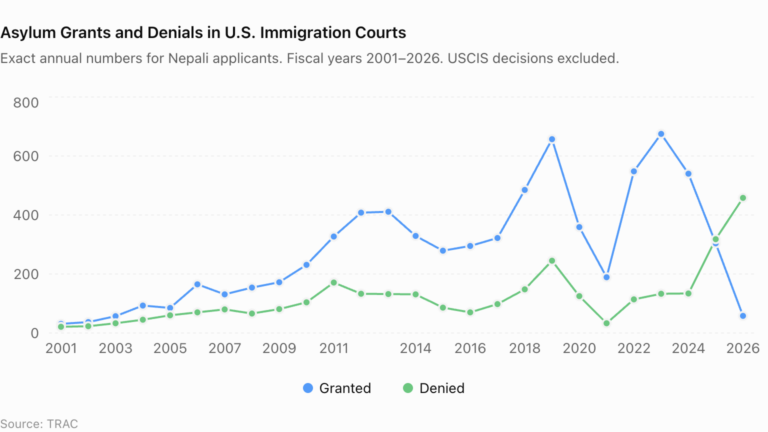
Asylum denials for Nepali applicants in immigration court rose to 458 from 318 in fiscal 2025, while grants of other forms of relief declined to 40 from 67. The number of denials was the highest in the TRAC annual series provided for this report, which covers fiscal years 2001 through 2026.
Separately, the Executive Office for Immigration Review (EOIR) reported that the nationwide immigration court backlog fell to 3,300,793 pending cases in fiscal 2026, down from 3,722,534 a year earlier, a decline of about 11.3 percent. The agency’s figures were generated on Oct. 22.
Historical asylum outcomes for Nepali applicants
| Fiscal year | Asylum granted | Asylum denied | Other relief granted | Reported total |
|---|---|---|---|---|
| 2001 | 31 | 21 | 1 | 53 |
| 2002 | 37 | 23 | 1 | 61 |
| 2003 | 57 | 33 | 1 | 91 |
| 2004 | 93 | 45 | 3 | 141 |
| 2005 | 85 | 60 | — | 145 |
| 2006 | 165 | 70 | — | 235 |
| 2007 | 131 | 80 | 2 | 213 |
| 2008 | 154 | 66 | 1 | 221 |
| 2009 | 172 | 81 | 2 | 255 |
| 2010 | 231 | 104 | 6 | 341 |
| 2011 | 327 | 171 | 11 | 509 |
| 2012 | 408 | 133 | 7 | 548 |
| 2013 | 411 | 132 | 10 | 553 |
| 2014 | 329 | 131 | 4 | 464 |
| 2015 | 279 | 86 | 6 | 371 |
| 2016 | 295 | 70 | 5 | 370 |
| 2017 | 322 | 98 | 2 | 422 |
| 2018 | 485 | 148 | 6 | 639 |
| 2019 | 657 | 245 | 10 | 912 |
| 2020 | 359 | 125 | 15 | 499 |
| 2021 | 189 | 33 | 6 | 228 |
| 2022 | 548 | 114 | 12 | 674 |
| 2023 | 675 | 133 | 26 | 834 |
| 2024 | 540 | 134 | 27 | 701 |
| 2025 | 304 | 318 | 67 | 689 |
| 2026 | 58 | 458 | 40 | 583 |
Source: Transactional Records Access Clearinghouse (TRAC)
Three Consecutive Years of Declining Immigration Court Grants
TRAC’s historical figures show a sharp reversal from fiscal 2023, when immigration judges granted asylum to 675 Nepali applicants, the highest annual total in the 2001-2026 series.
Grants fell to 540 in fiscal 2024, then to 304 in 2025 and 58 in 2026. Over the same period, denials increased from 133 in 2023 to 134 in 2024, 318 in 2025 and 458 in 2026.
Among fiscal 2026 cases identified specifically as asylum grants or denials, about 88.8 percent resulted in denials and 11.2 percent in grants. In fiscal 2025, denials accounted for about 51.1 percent of those two categories.
The 2026 immigration court grant total marked a return to levels last seen more than two decades ago. Nepali applicants received 31 asylum grants in fiscal 2001, 37 in 2002 and 57 in 2003.
Annual grants subsequently increased, reaching 172 in 2009, 411 in 2013 and 657 in 2019. After falling to 359 in 2020 and 189 in 2021, grants rebounded to 548 in 2022 and peaked at 675 in 2023.
More Than 7,300 Immigration Court Grants Over 26 Fiscal Years
TRAC’s aggregate figures for fiscal 2001 through 2026 list 10,752 outcomes involving Nepali applicants in immigration court: 7,342 asylum grants, 3,139 asylum denials and 271 grants of other forms of relief.
Asylum grants accounted for about 68.3 percent of those outcomes, denials for 29.2 percent and other forms of relief for 2.5 percent.
Counting only asylum grants and denials, about 70.1 percent of cases resulted in grants over the full period, substantially higher than the 11.2 percent grant share recorded in fiscal 2026.
These historical figures cover immigration court proceedings only. They do not include affirmative asylum applications decided by USCIS and therefore cannot be used to calculate the overall asylum approval rate for Nepali applicants in the United States.

How Nepali Applicants Compare With Nationwide Immigration Court Outcomes
Nationwide immigration court figures for fiscal 2001 through 2026 show 1,135,897 categorized asylum-related outcomes, including asylum grants, denials and grants of other forms of relief. Of those outcomes, 391,496 resulted in asylum grants, 693,388 in denials and 51,013 in grants of other forms of relief.
Asylum grants accounted for about 34.5 percent of nationwide categorized outcomes, while denials represented approximately 61 percent. Other forms of relief accounted for about 4.5 percent.
By comparison, asylum grants accounted for 68.3 percent of categorized outcomes involving Nepali applicants over the same 26 fiscal years. Denials represented 29.2 percent, while other forms of relief accounted for 2.5 percent.
The comparison shows that Nepali applicants had a substantially higher share of asylum grants in immigration court than applicants nationwide over the period. The figures also exclude affirmative asylum decisions made separately by USCIS.
Fiscal 2026: Nepali Applicants Compared With Nationwide Results
Nationwide immigration court figures for fiscal 2026 show 158,513 categorized outcomes: 138,889 asylum denials, 10,516 asylum grants and 9,108 grants of other forms of relief.
Asylum grants accounted for about 6.6 percent of nationwide categorized outcomes, while denials represented approximately 87.6 percent. Other forms of relief accounted for about 5.7 percent.
Among Nepali applicants, immigration judges recorded 58 asylum grants, 458 denials and 40 grants of other forms of relief. Considering only cases resulting in an asylum grant or denial, 11.2 percent resulted in grants and 88.8 percent in denials.
The 11.2 percent asylum grant share among Nepali applicants was higher than the nationwide share of 6.6 percent in fiscal 2026. It also does not include USCIS affirmative asylum decisions.

Monthly Immigration Court Asylum Grants Remain Low
Monthly TRAC figures show that immigration judges granted asylum to 16 Nepali applicants in October 2025, six in November and seven in December.
Grants totaled five in January 2026, one in February, one in March, six in April, one in May, three in June, five in July, four in August and three in September.
Together, the monthly figures account for all 58 asylum grants recorded in immigration court during fiscal 2026. The monthly figures also do not include separate affirmative asylum decisions made by USCIS.
Nationwide Immigration Court Completions Rise as New Cases Decline
Across the immigration court system, total case completions rose to 973,669 in fiscal 2026 from 798,975 in fiscal 2025, an increase of about 21.9 percent, according to EOIR. Initial case receipts fell to 528,889 from 562,376, a decline of about 6 percent.
The pending caseload decreased by 421,741 cases during fiscal 2026. Compared with its fiscal 2024 peak of 3,924,917, the backlog was down by 624,124 cases, or about 15.9 percent.
The decline followed years of growth. Pending cases increased every year from fiscal 2017 through fiscal 2024 before falling in both 2025 and 2026. Despite those recent reductions, the backlog remained more than three times its fiscal 2017 level of 975,999 cases.
New case receipts peaked at 1,783,908 in fiscal 2024 before dropping sharply in 2025. Meanwhile, completions increased each year after falling to 115,968 in fiscal 2021, reaching their highest level in the agency’s 2017-2026 series in fiscal 2026.
EOIR’s pending-case and initial-receipt figures cover removal, deportation, exclusion, asylum-only and withholding-only proceedings.